Understanding Economic Data Needs
We studied how stakeholders interact with real-time economic metrics to shape feature priorities.Step 1
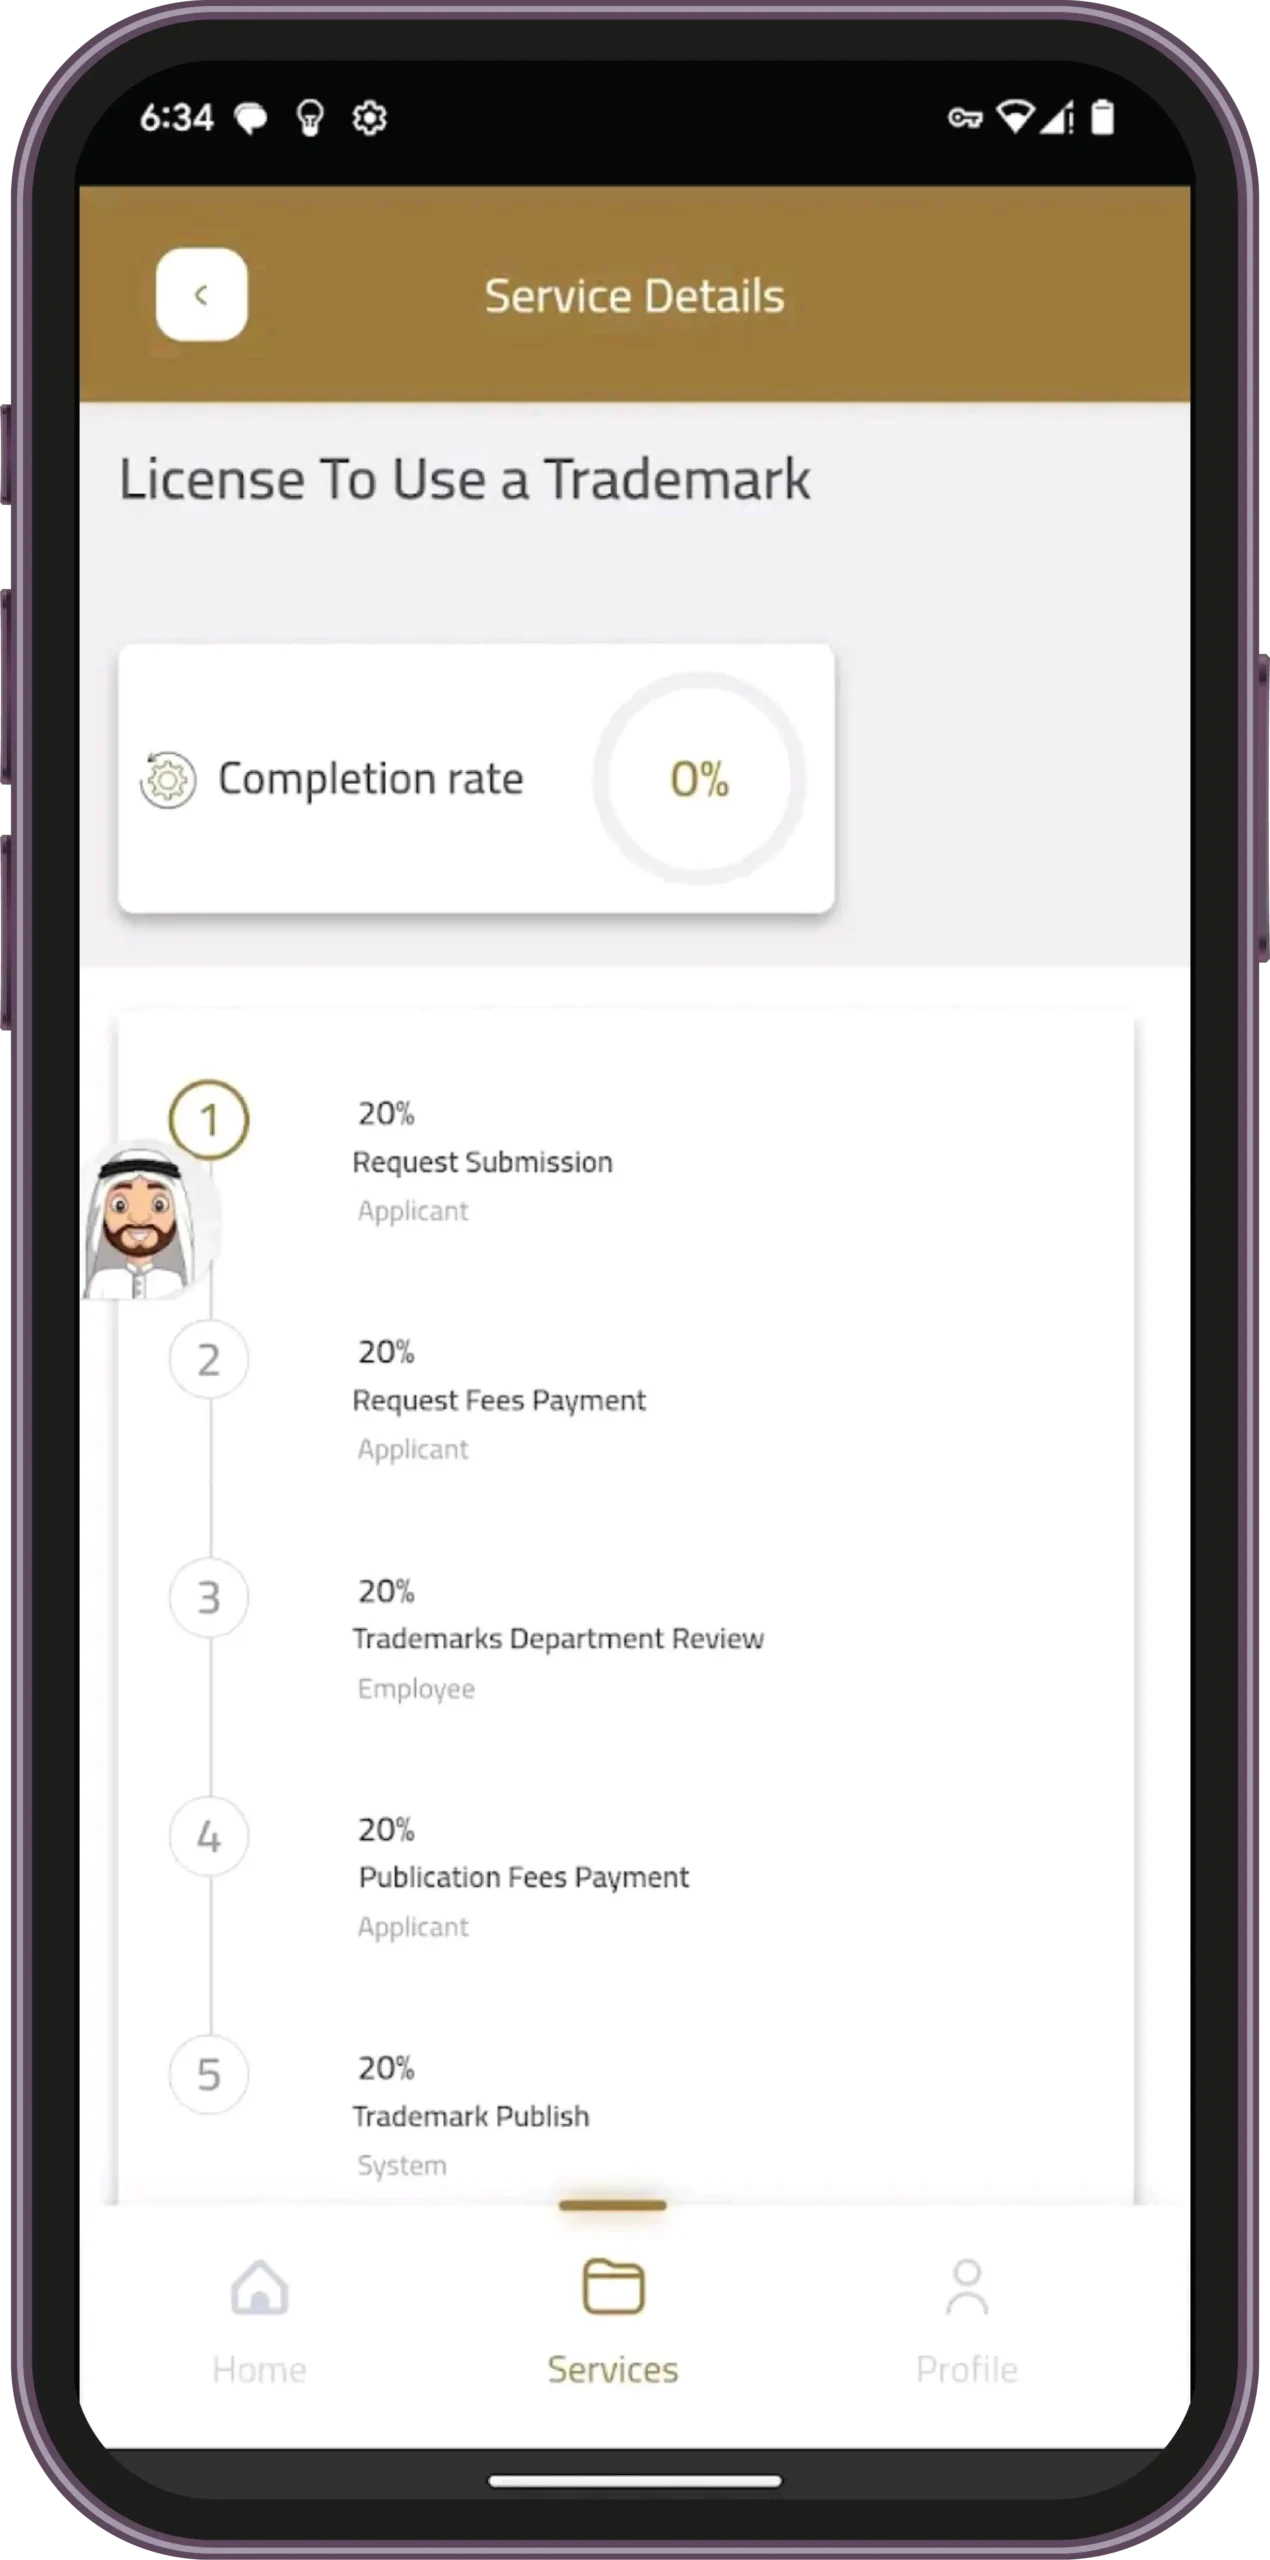
Data Infrastructure Planning
Designed APIs and schemas for secure, real-time syncing between databases and visual dashboards.
Step 2
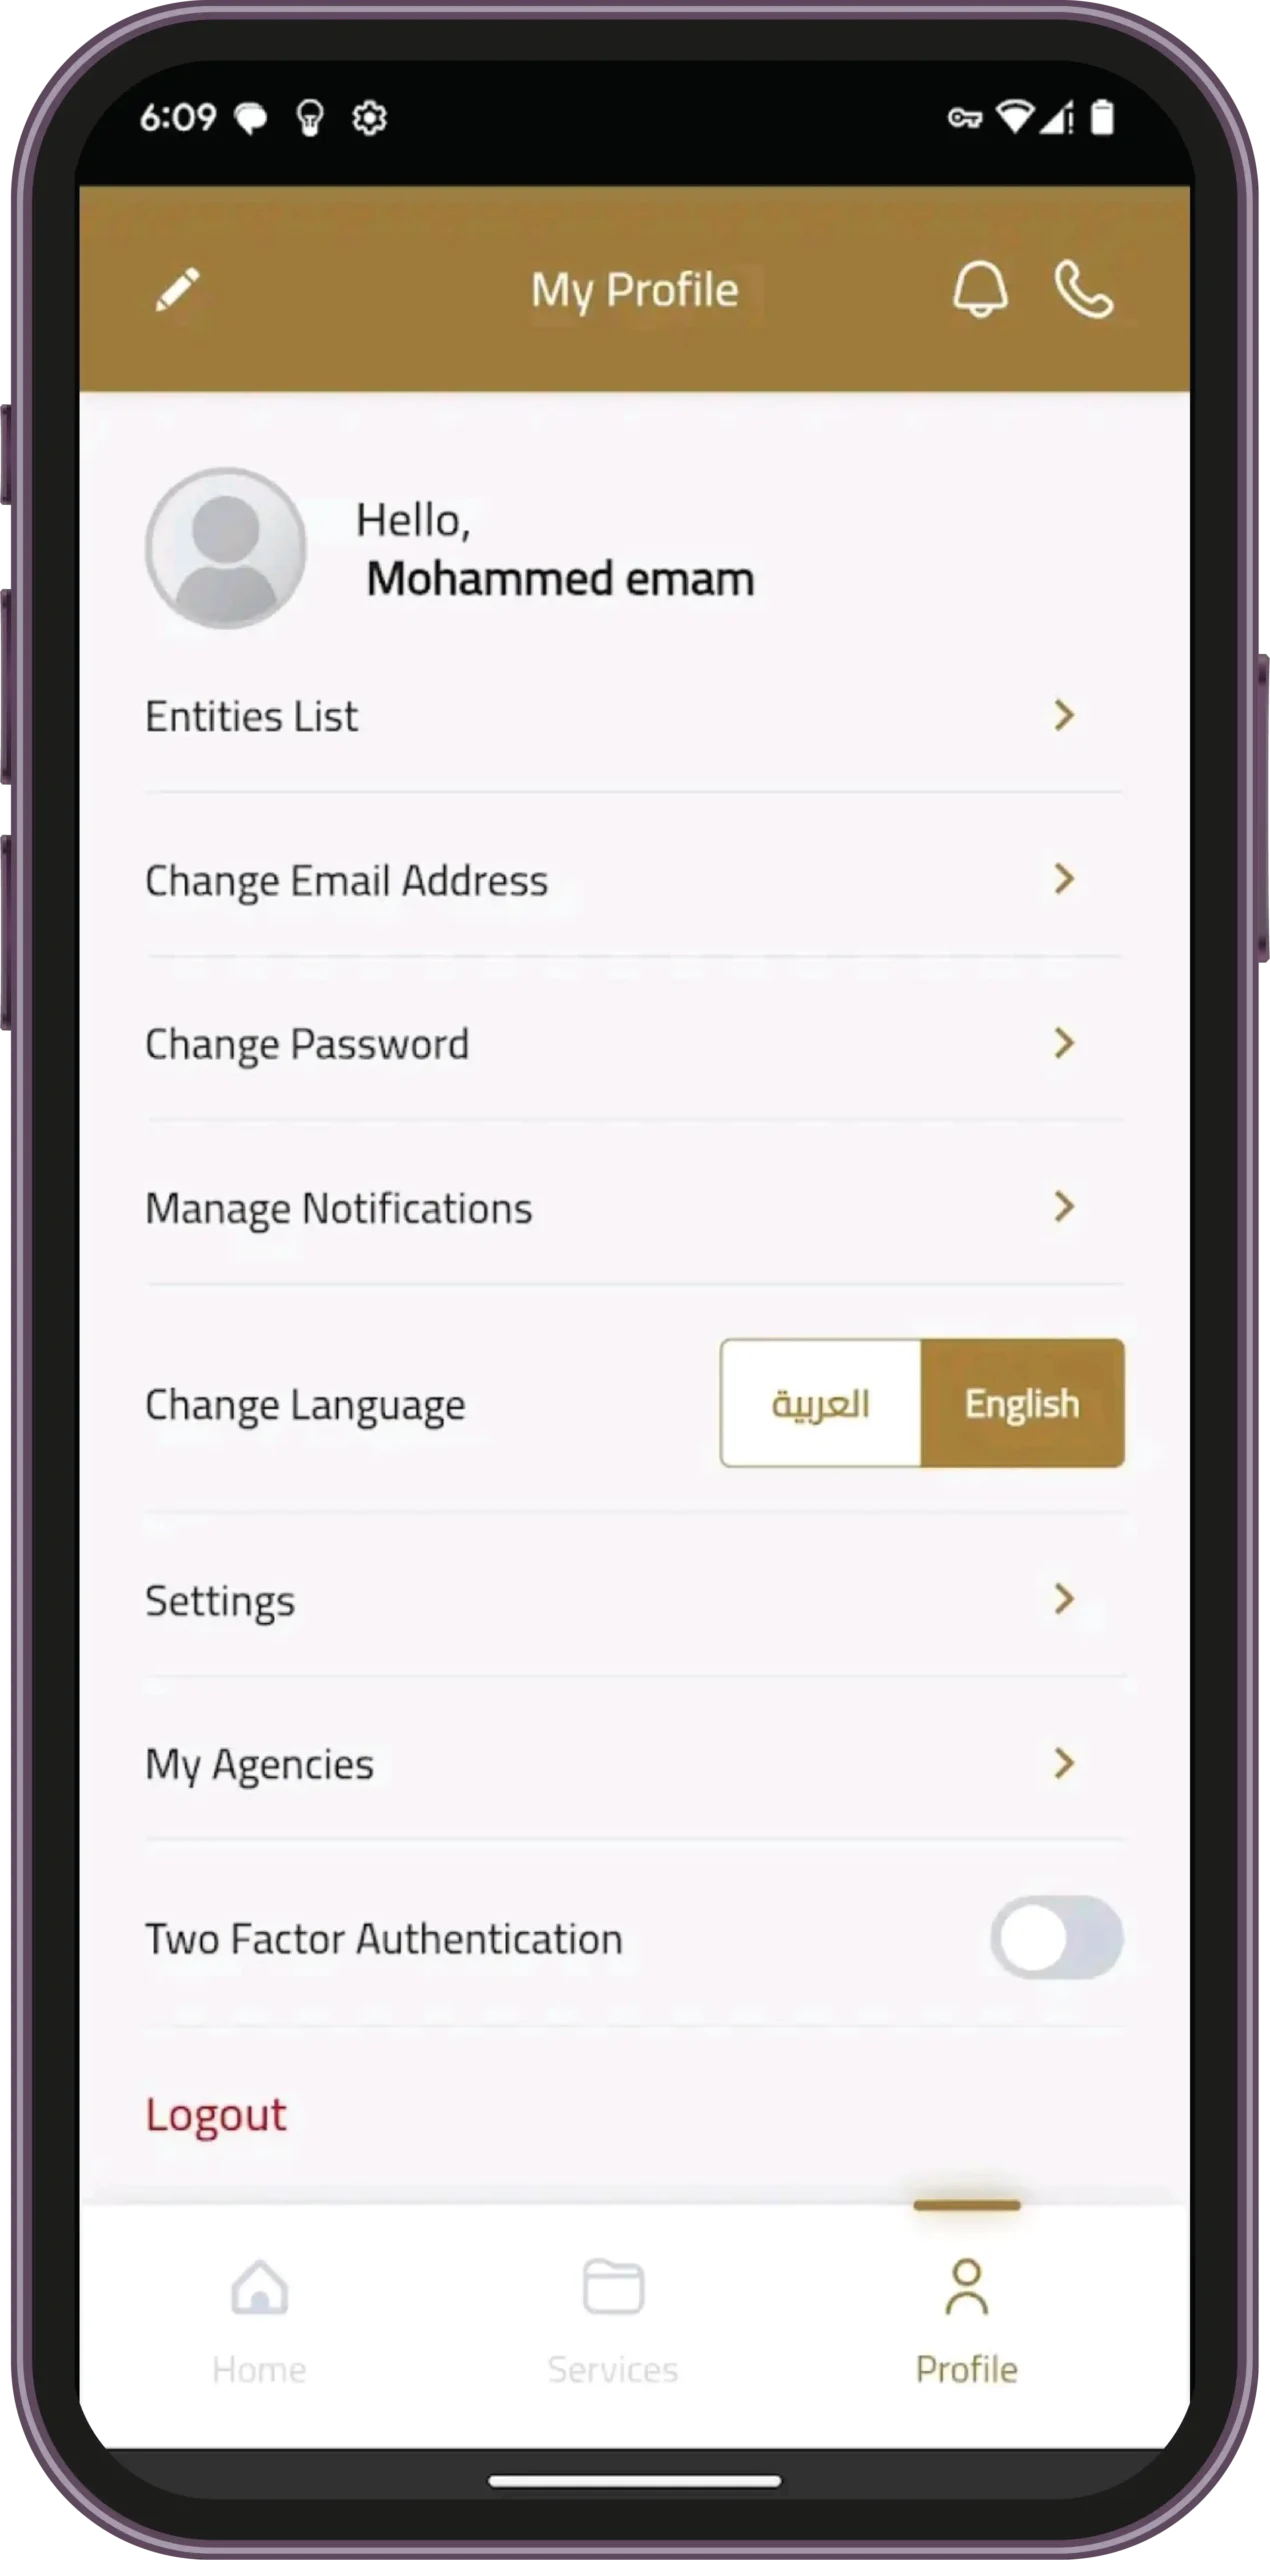
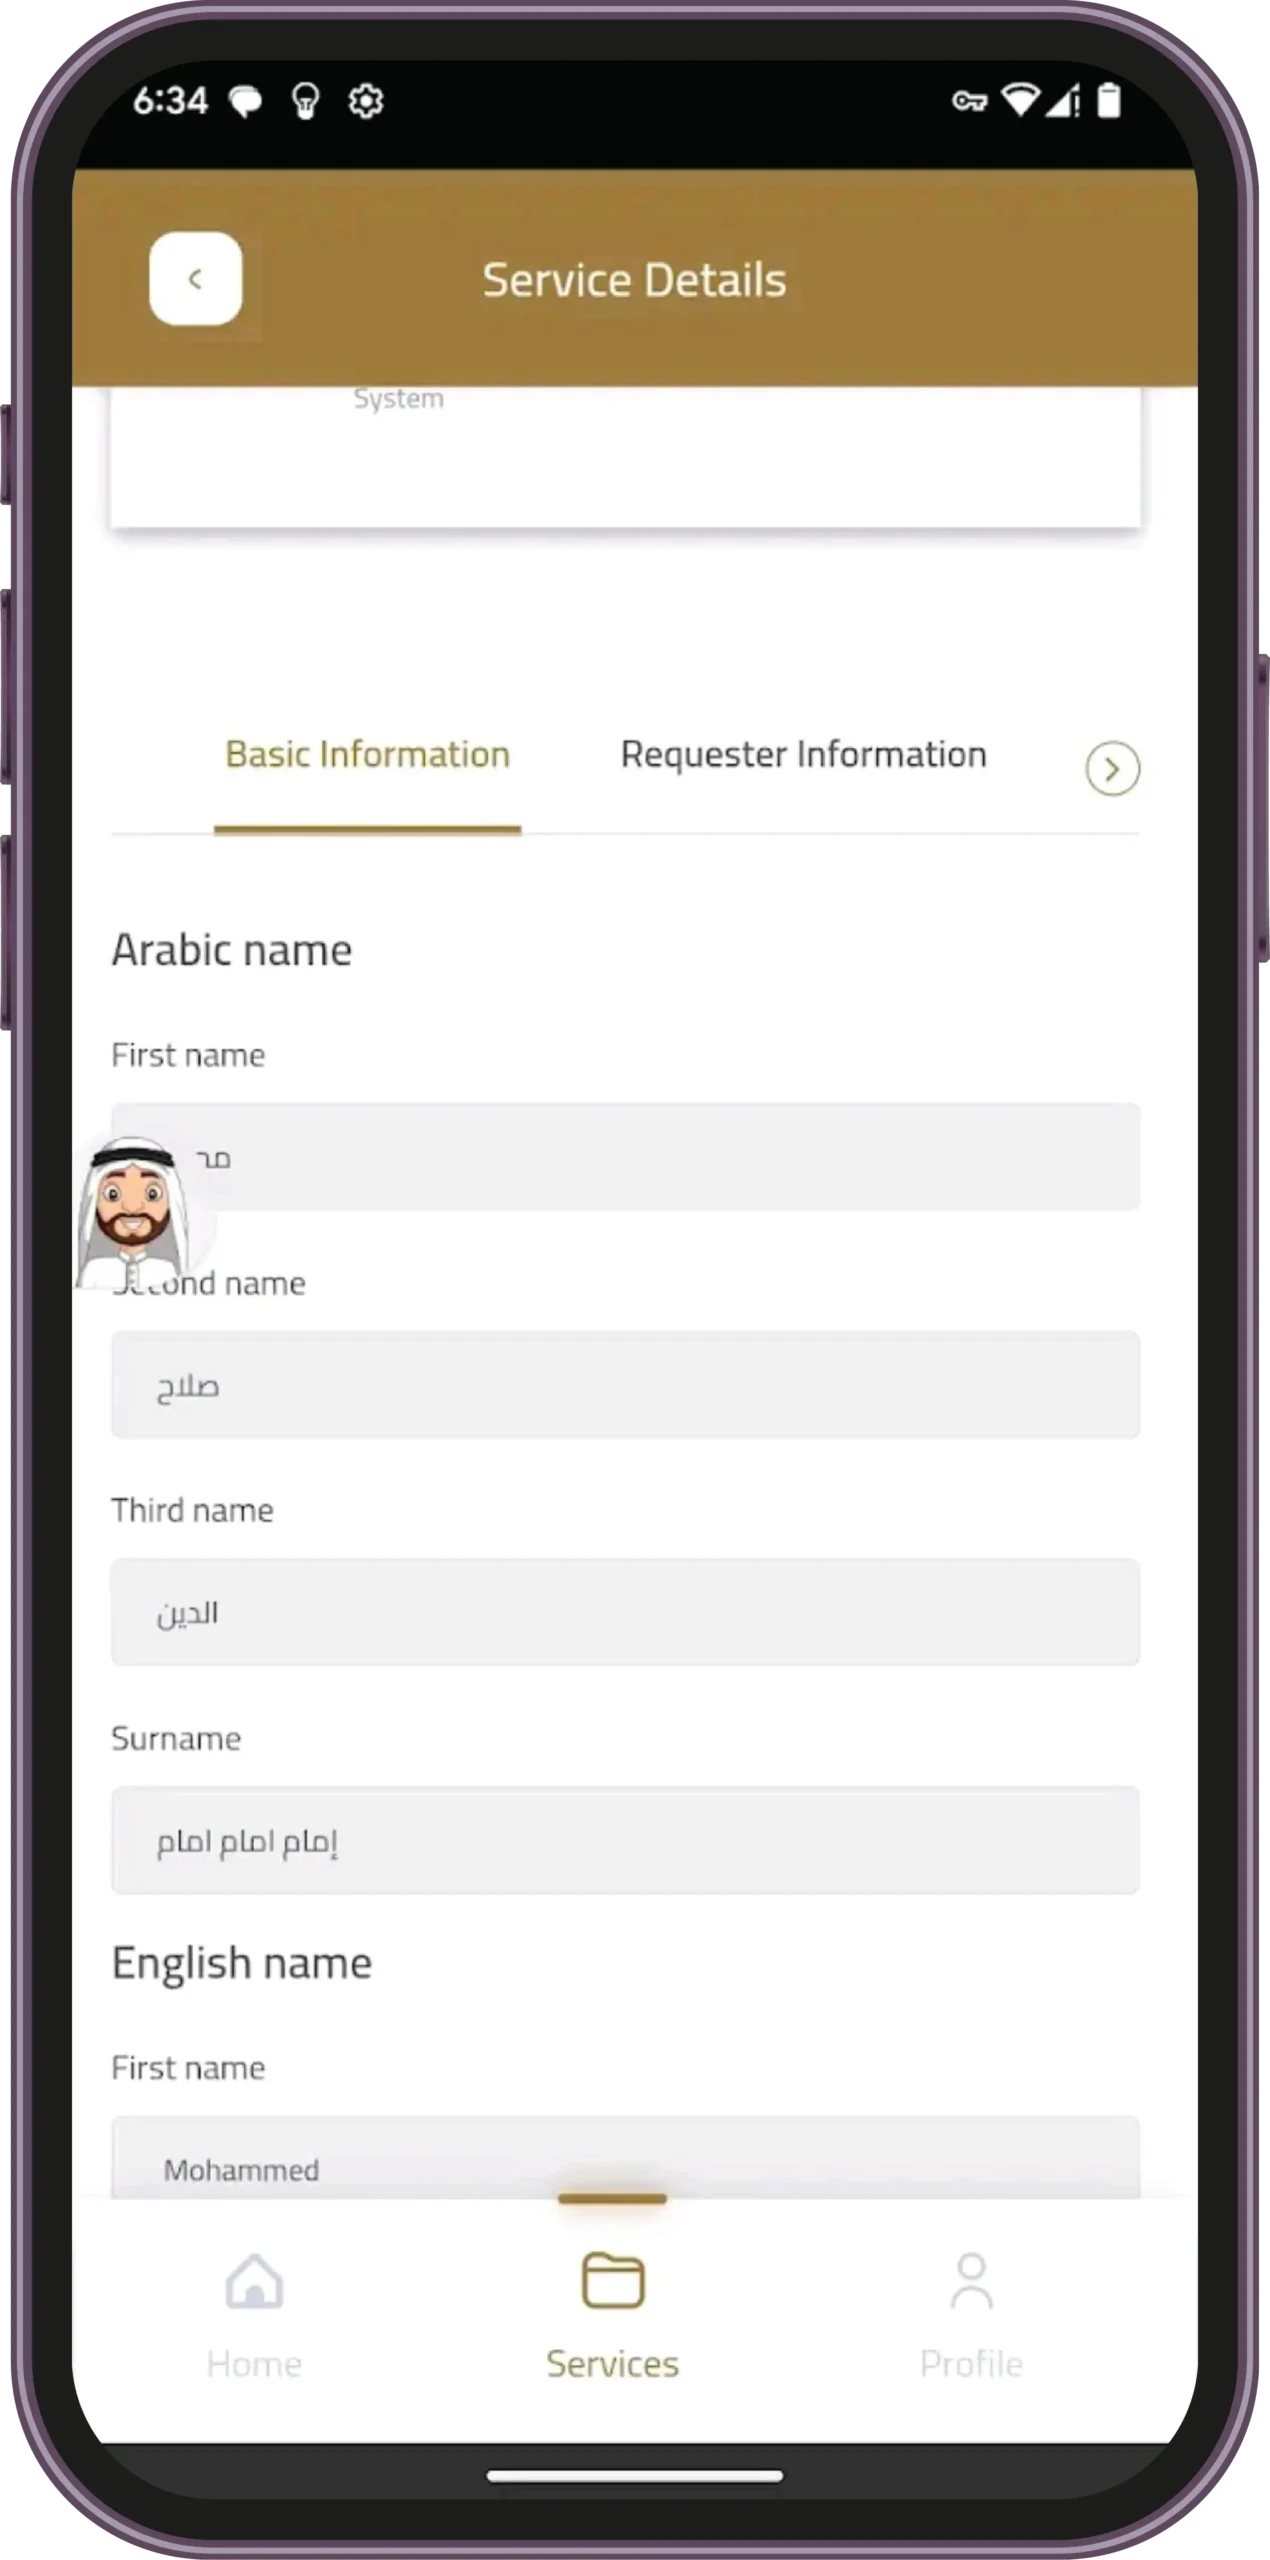
UX/UI Wireframes
Created high-fidelity wireframes for ministry, admin, and general user roles, optimized for KPI tracking.
This stage ensured data visualization components were not only accurate but highly user-friendly, enhancing both the layout and interactivity for complex metric tracking.
Step 3
Agile Development
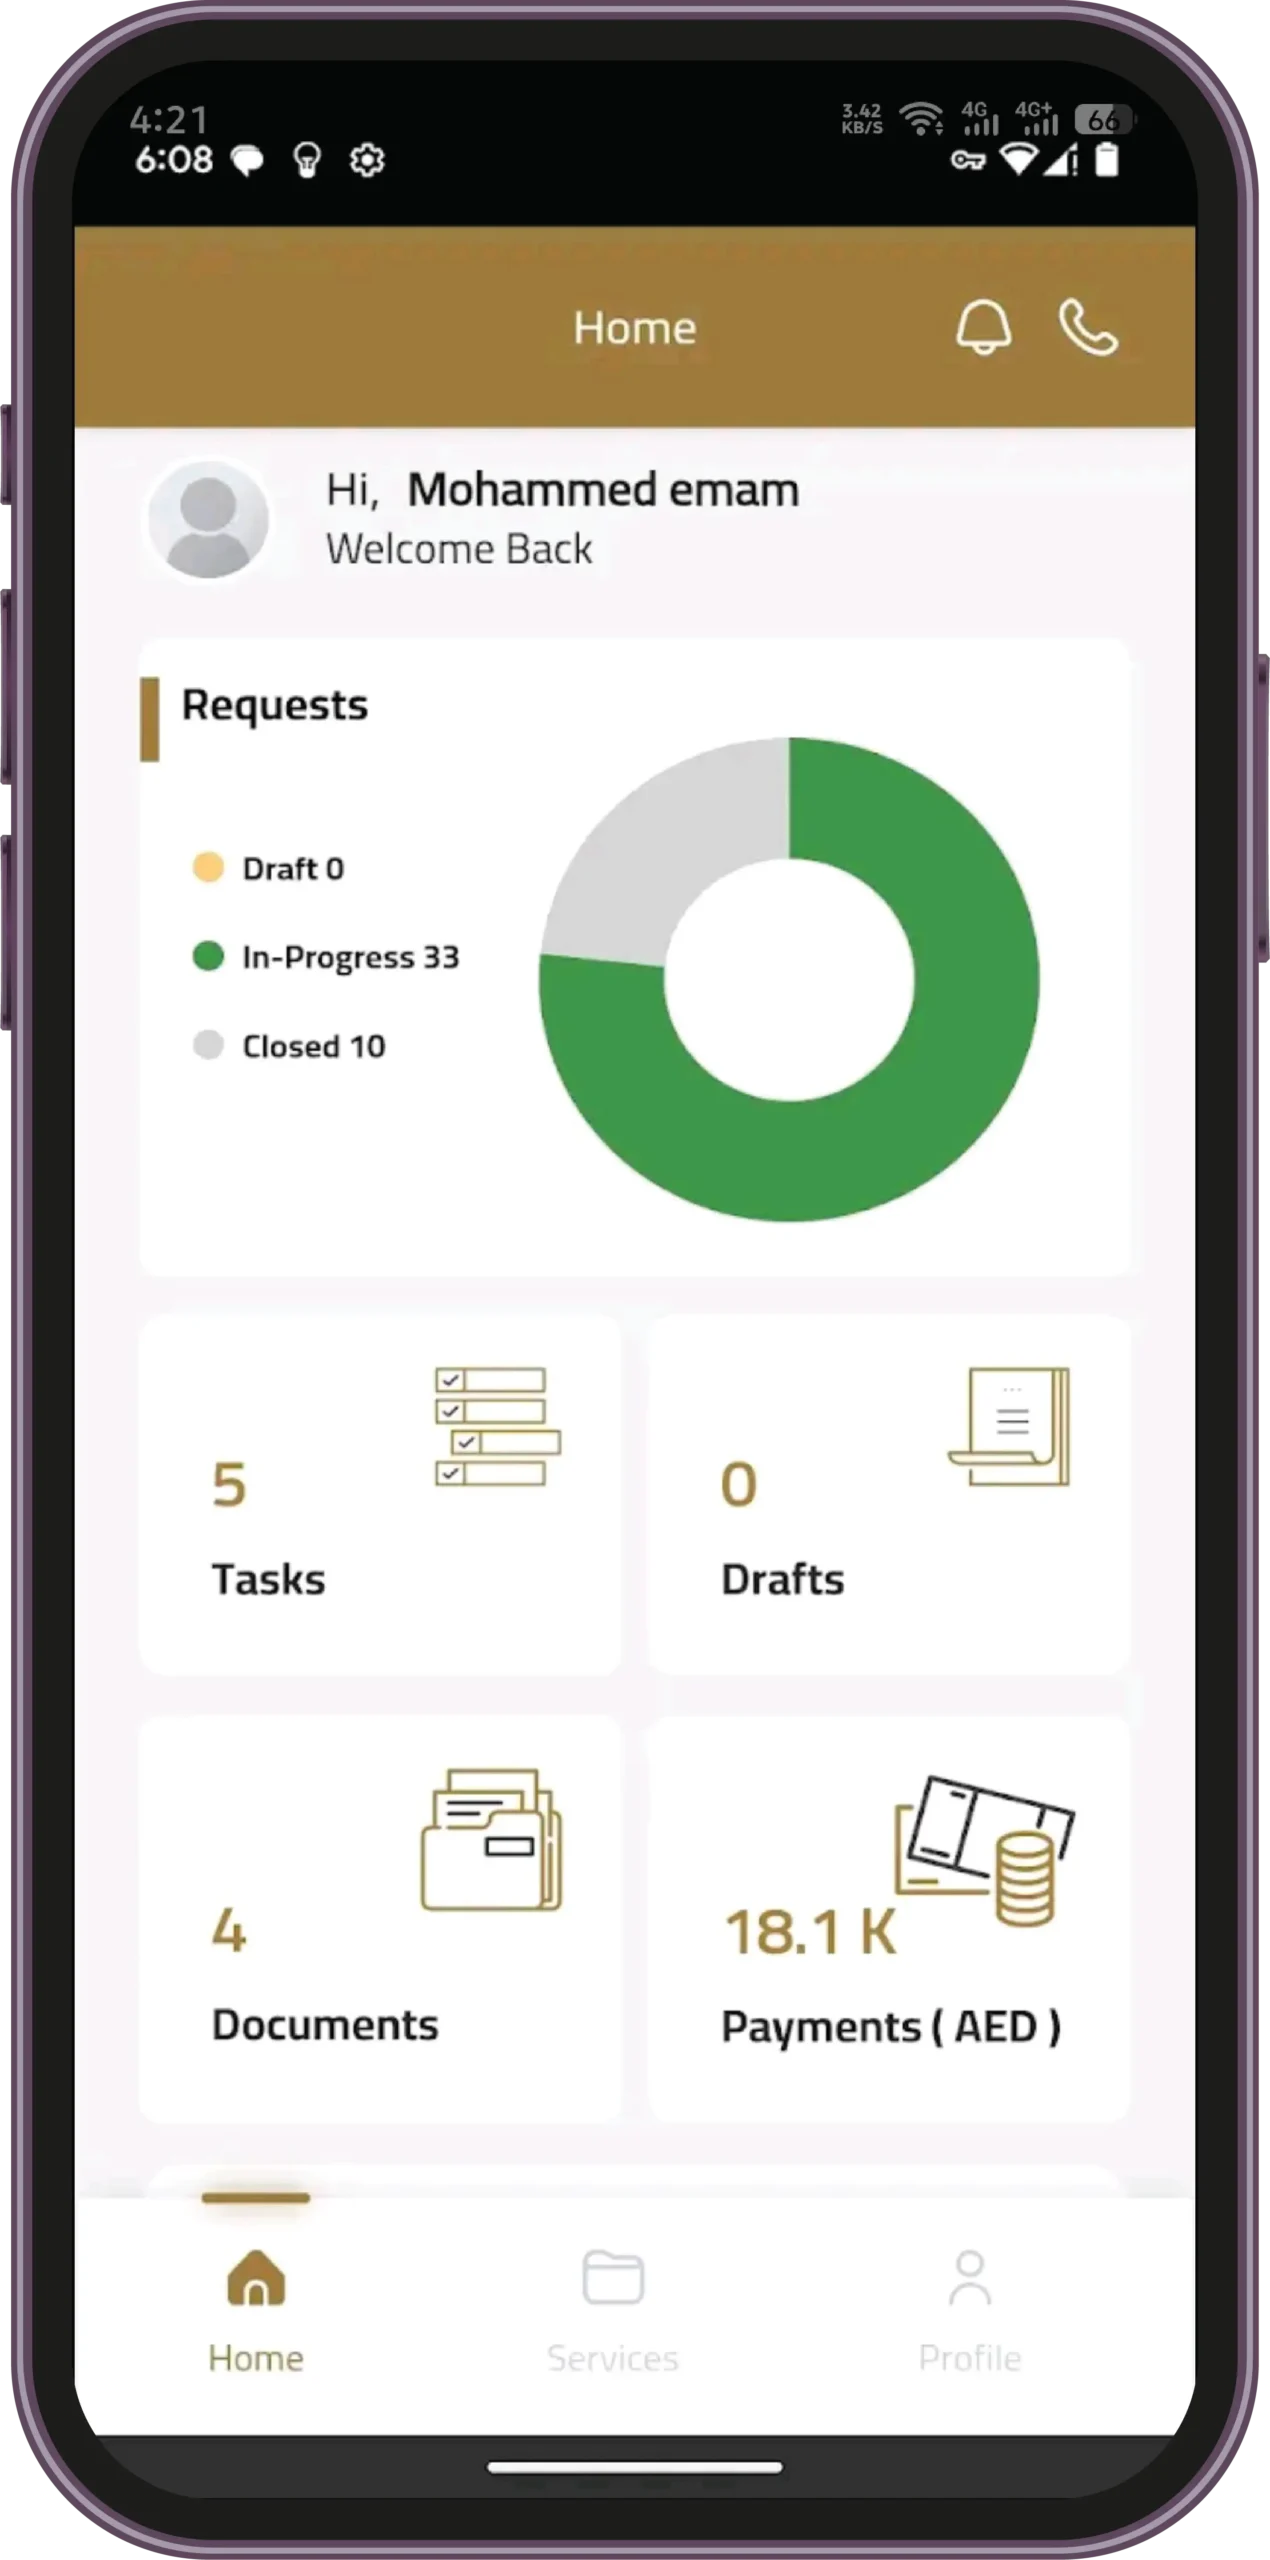
Implemented dashboards using Flutter and React; integrated Node.js, PostgreSQL, and Firebase for backend scalability.
This phase focused on ensuring performance, with responsive chart rendering, instant data refresh, and scalable architecture for high-load periods.Step 4
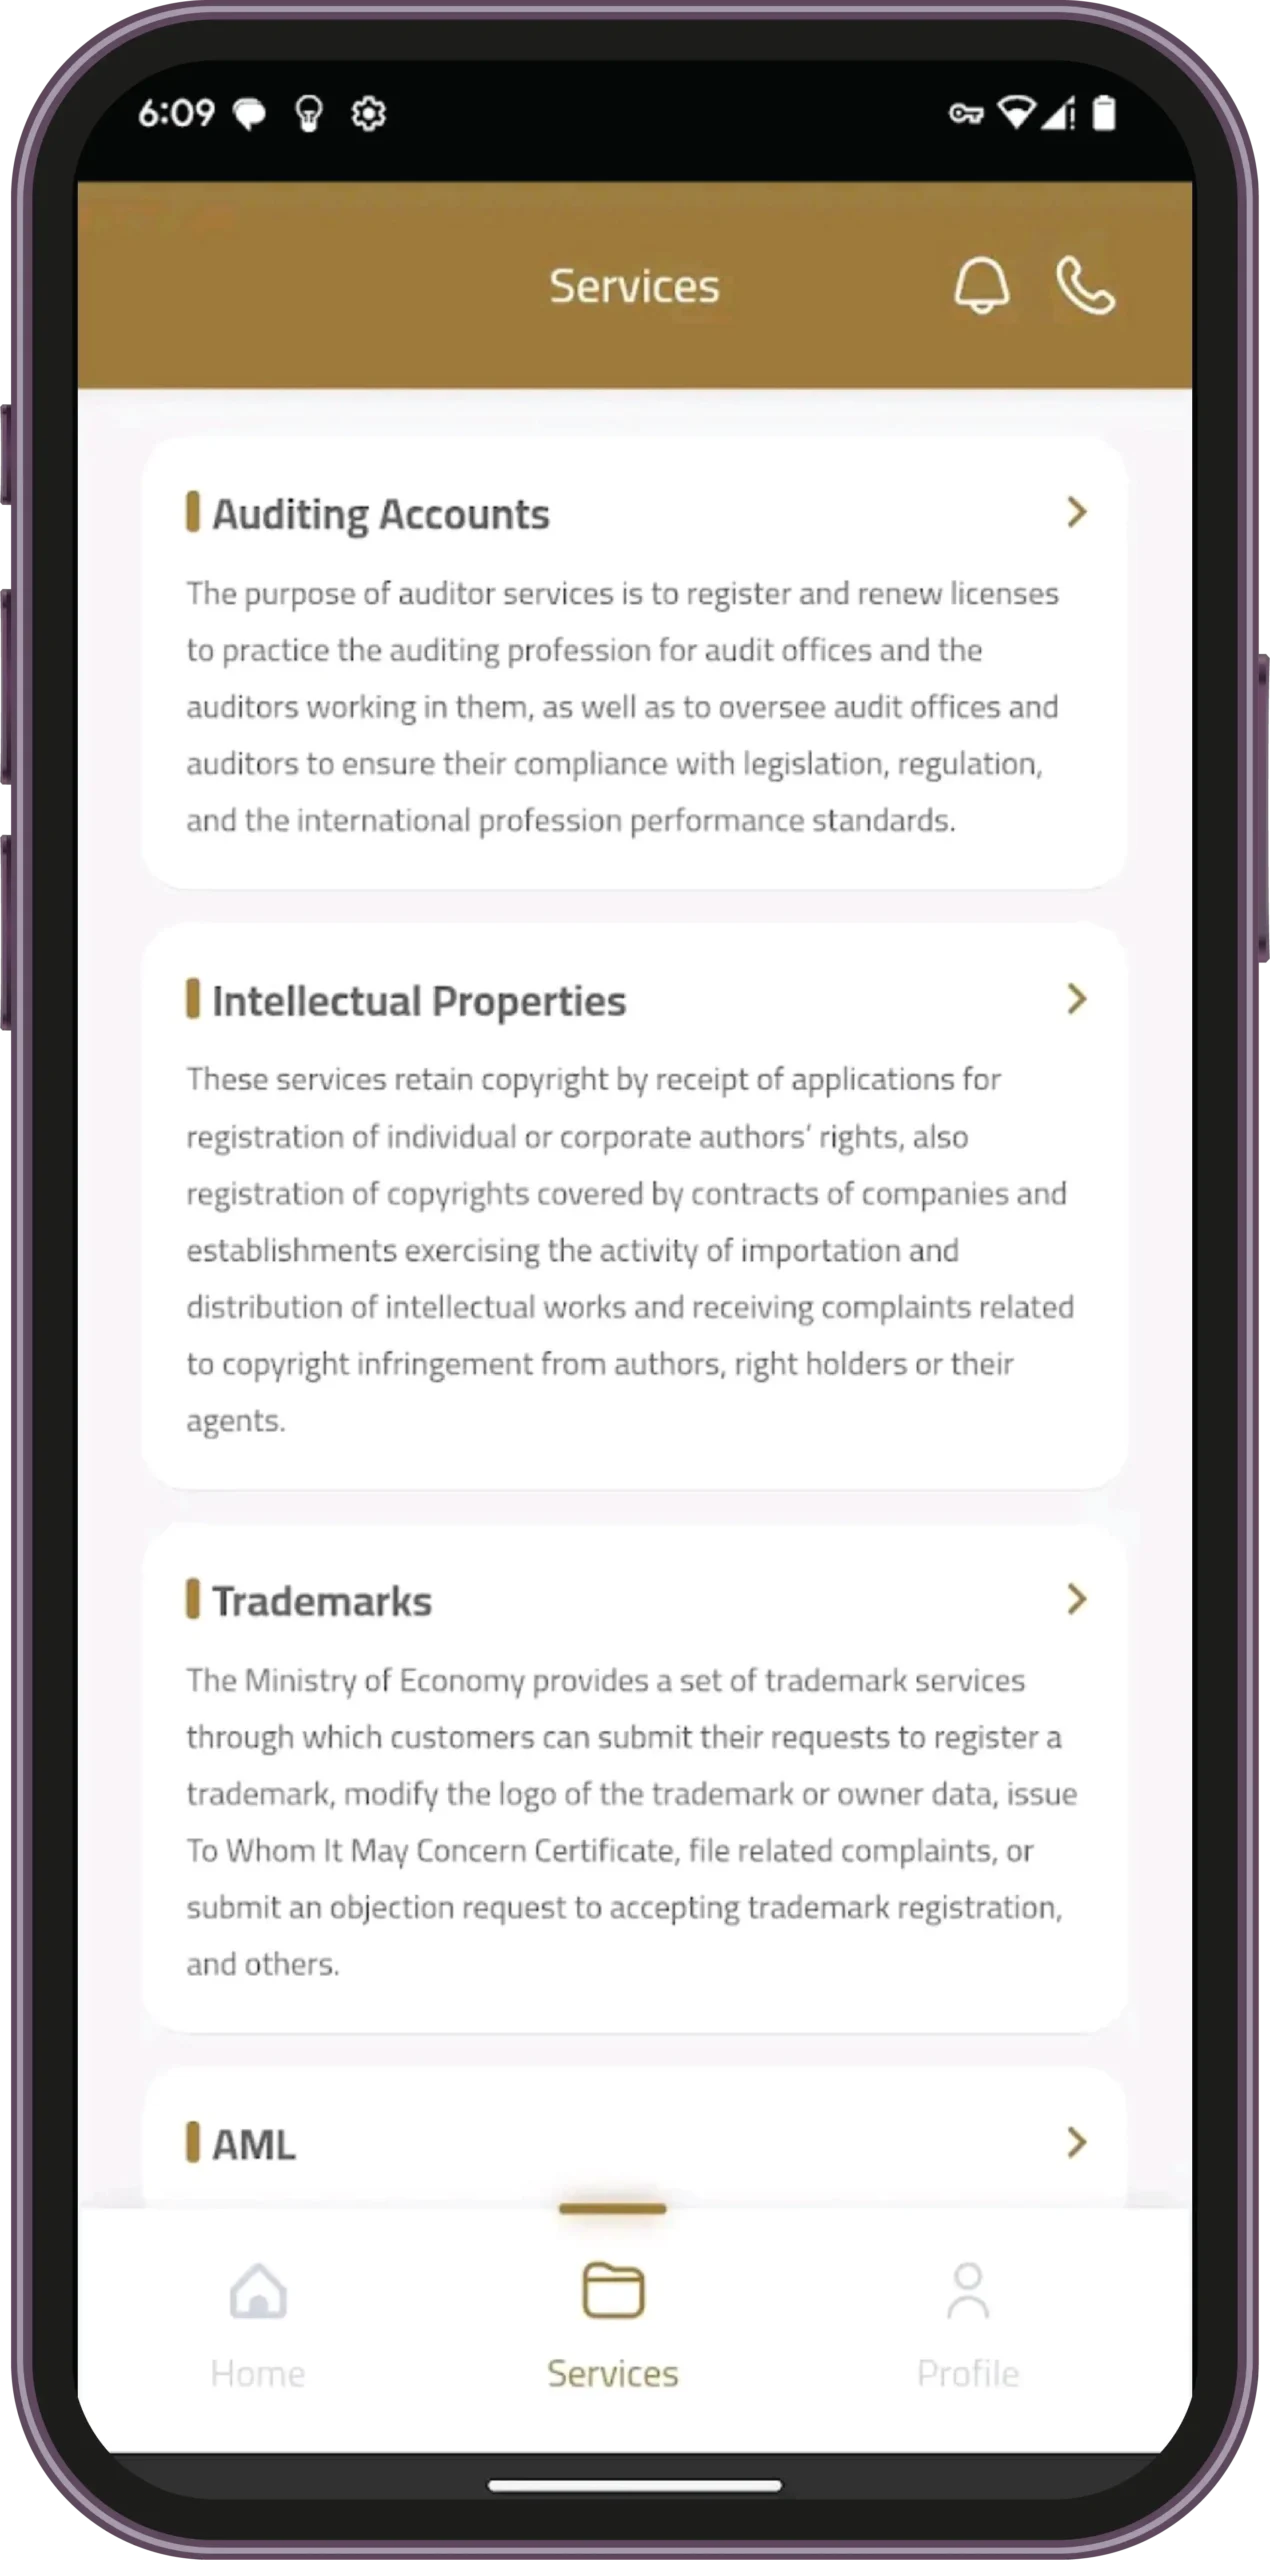
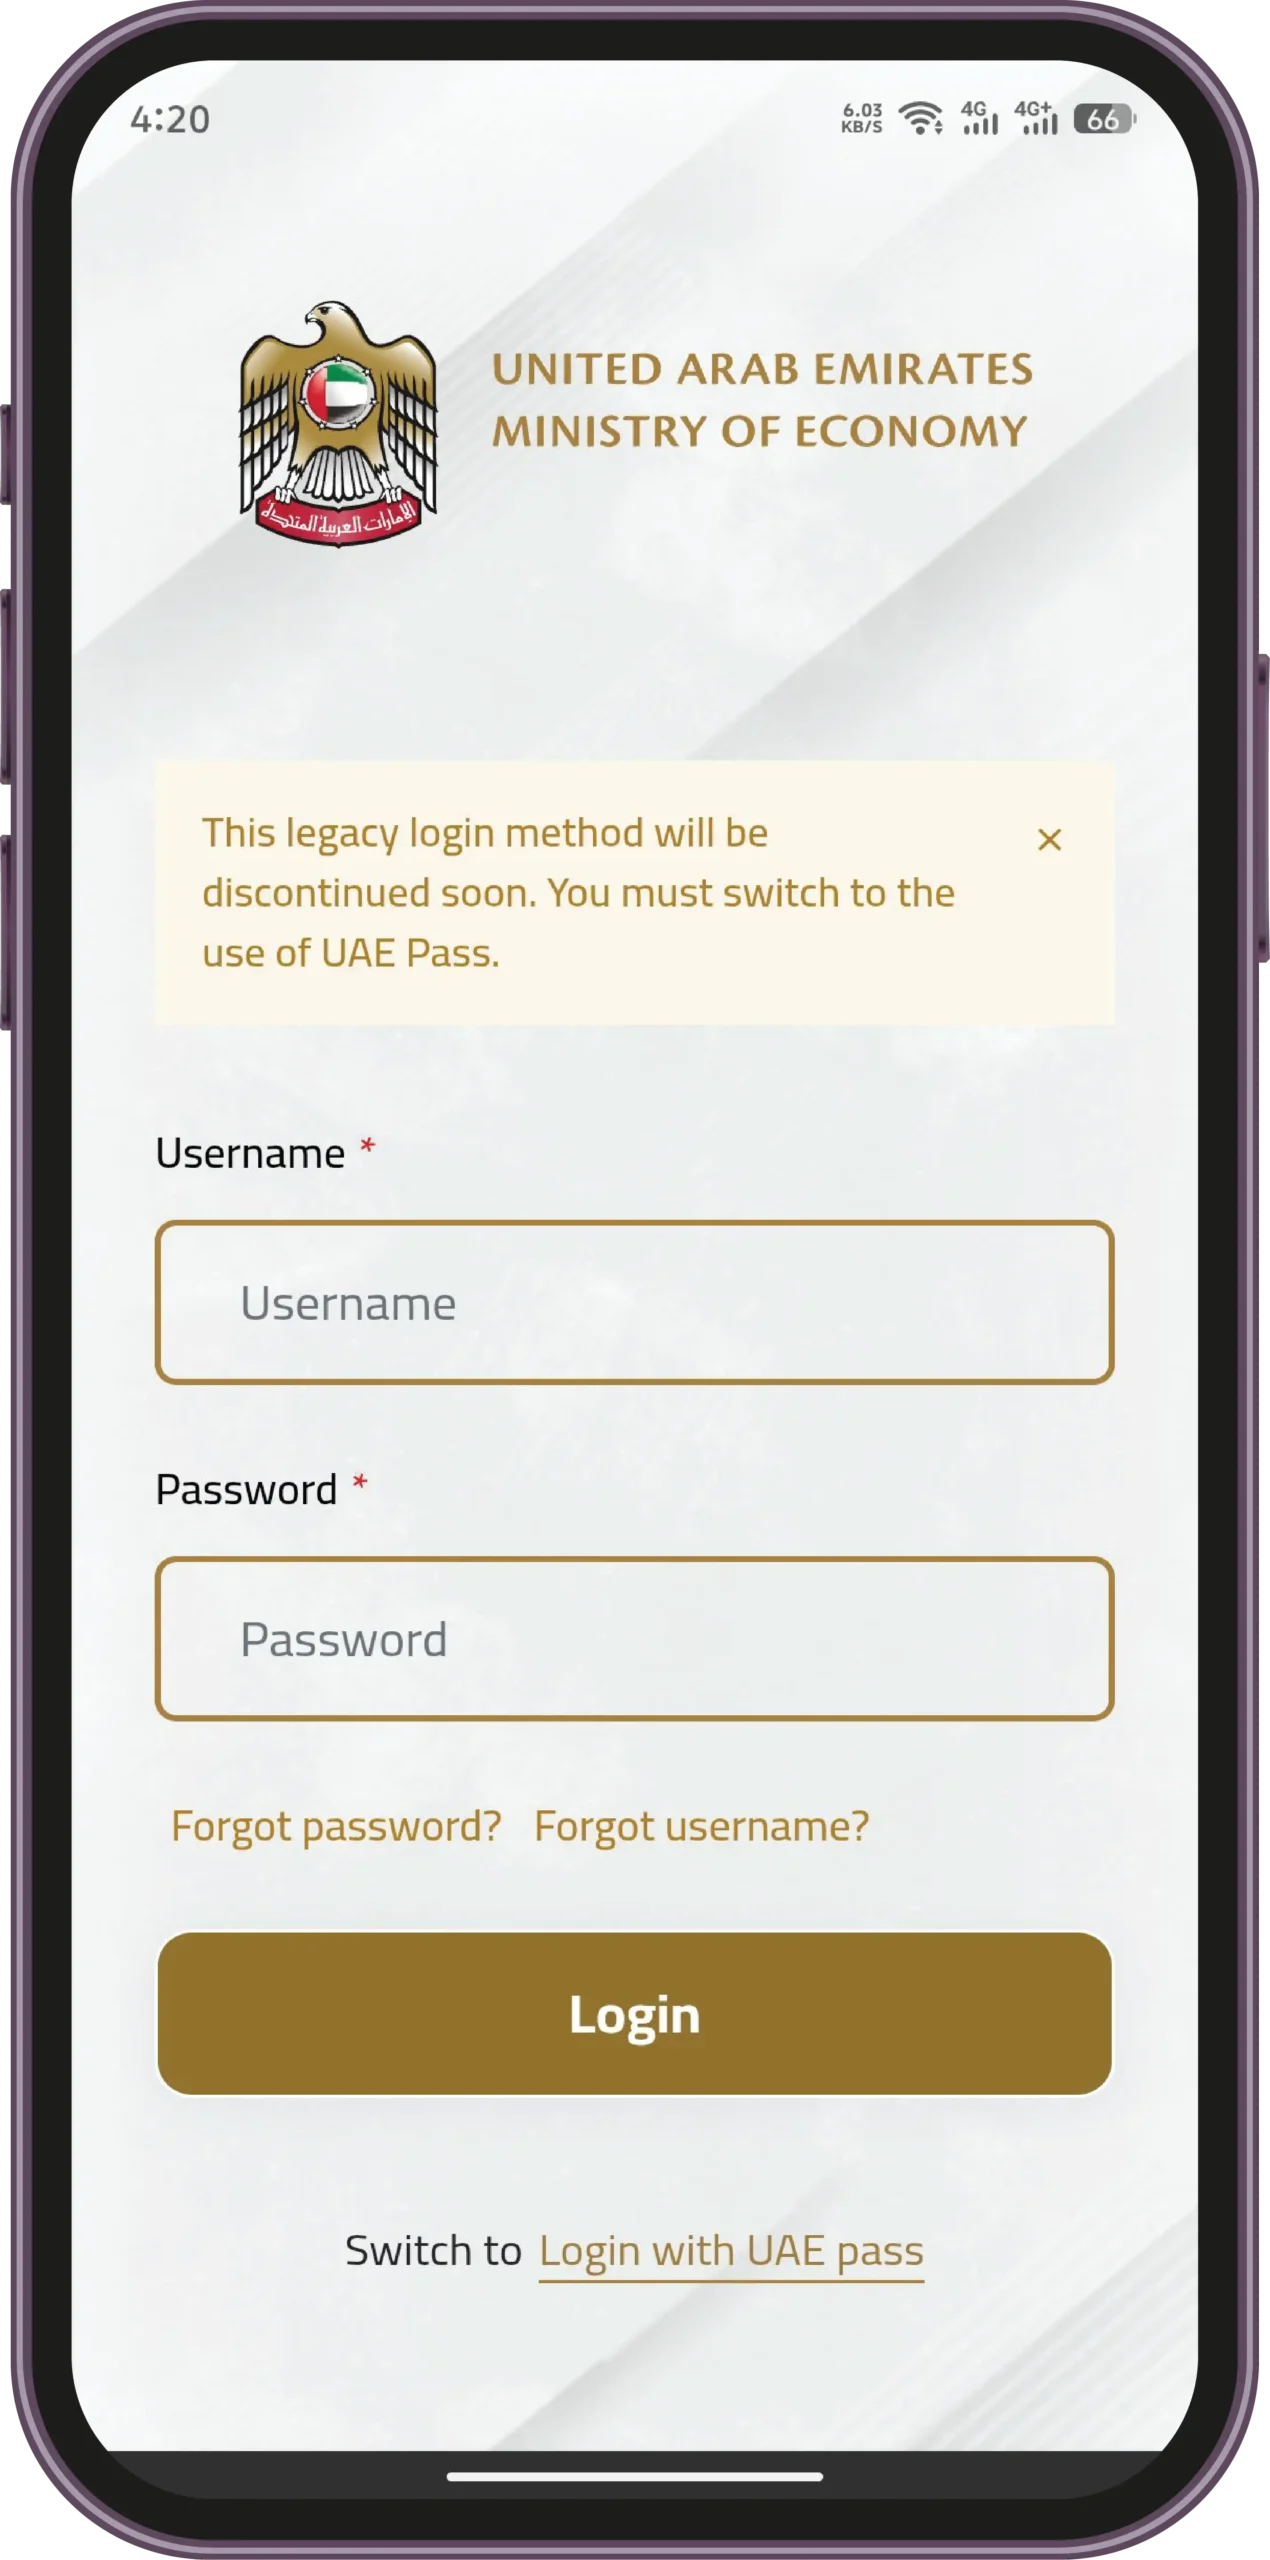
Testing & Localization
Conducted multilingual testing for Arabic, English, and French. Final app was deployed across devices with secure role-based access.
Multilingual QA ensured seamless switching between languages, localized KPI formats, and cultural design considerations for better user engagement.Step 5